
Discover practical advice, inspiration, and insights to help you succeed in business and grow both personally and professionally.
Found 0 posts
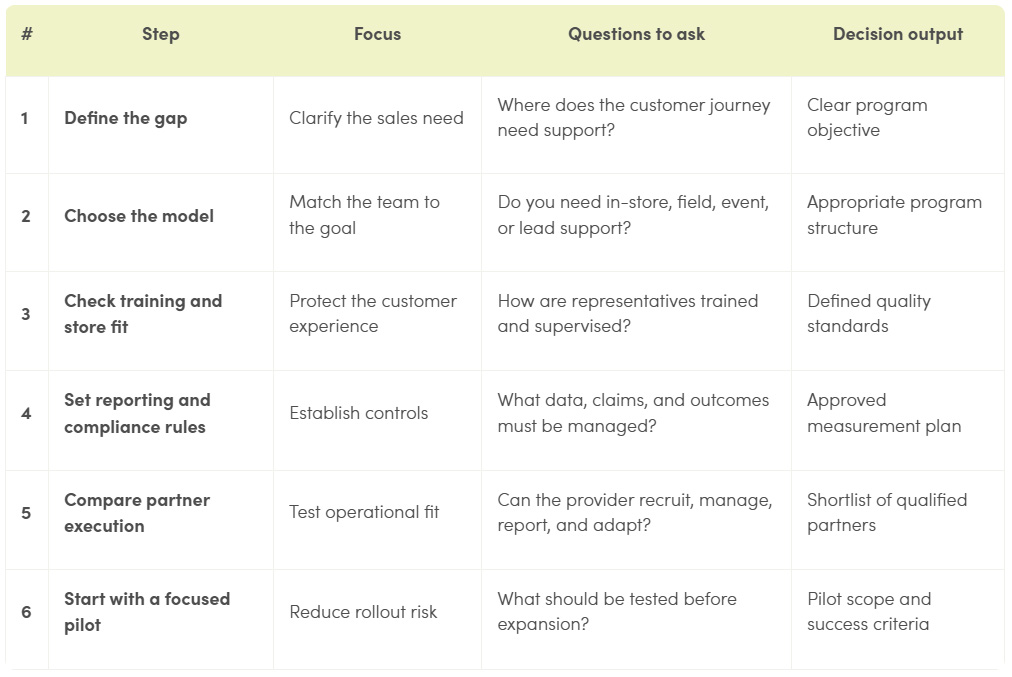
While many smaller brands express some worry when it comes to outsourcing sales, it has proven to be a reliable way to break into new markets, deploy new products, or even just supplement an existing sales team. Retail sales outsourcing can add trained staff and field support without requiring a full internal build, which is made especially effective when you choose an outsourcing partner that knows how to work within retail environments and represent a brand within a store/retailer’s culture.
The key is finding the right outsourcing partner and model, which depends on the customer journey, store setting, compliance needs, and reporting plan. This guide breaks down where an outside team may help, and what to review before choosing a partner.
“Retail growth depends on delivering consistent customer experiences wherever buying decisions happen.”
As with any sizable business investment, decision makers should start with the problem. Figure out whether your biggest sales need is getting more product help at the shelf, wider store coverage, help breaking into new markets, or a quick increase in headcount to push a new product.
Outsourcing generally best fits work that is local, specialized, or hard to staff; it doesn’t need to be all of these things at once, though. It may also support an internal team instead of replacing it. In the end, the need must define the role of your outsourced sales partner.
Retail sales outsourcing may include in-store teams, field teams, or event teams. In-store staff can explain products, run demos, answer questions, and even sell themselves. Field teams can cover several locations. Event teams can support pop-ups, sampling, trade shows, and launches.
Some programs use more than one model. A launch could use event staff for awareness and in-store staff for product education and sales conversion.
Representatives are a visible part of the brand whether they are in-house or outsourced. Ask how the outsourced staff are trained on product details, approved claims, store rules, customer questions, and escalation steps to ensure they have enough runway for a successful deployment. It may also be helpful to inquire about what comparable brands they’ve worked with.
Training should fit the store. Staff need a clear message regardless of setting, but they also need room to answer real questions in a way that doesn’t feel rushed or rehearsed if they are in an environment where they’ll be dealing with a low volume of potential customers that want longer or more in-depth engagements. A single script may not work in every store or with every shopper.
Retailers should confirm how training is inspected, updated, and checked in the field. They should also ask how the provider handles product changes, store-specific rules, and customer concerns. Both of these play a key role in ensuring that value is maximized across every sales setting, and working with a quality outsourcing partner that truly understands the important nuances of representing a brand within a retail environment. The best do this by working alongside store employees and management, rather than just taking a post in a designated area and approaching prospects in an isolated manner, disconnected from the rest of the shopping experience.
Set a program goal before choosing reporting measures, so you know exactly what it is you’ll be reporting. An education program may track demos, questions, and feedback since the goal is simply to increase awareness or dispel initial customer concerns. A customer-acquisition program is more likely to strictly track leads, purchases, and/or handoffs. An event program may rely more on engagement and follow-up data that is indicative of a future purchase in industries with longer sales cycles.
Ask how data is collected, checked, shared, stored, and deleted. Clarify who owns customer data, and set a process for complaints and hard questions.
Finally, the Federal Trade Commission says advertising claims must be truthful, not misleading, and supported by evidence.¹ Retailers should review claims, disclosures, offers, and data practices with the right legal and compliance teams to avoid unnecessary liability.
A client list is only one part of the review; you should also ask how the provider recruits, trains, schedules, supervises, and reports on the team and compliance processes. Also, ask how it handles store coordination and program changes.
Compare each provider’s stated services with your campaign's needs by asking for examples that match your store type, customer, sales cycle, and market.
Review whether the partner can support the full operating process. That may include recruiting, training, scheduling, field supervision, reporting, and adjustments during the program.
A pilot can test the relationship before a wider rollout. Set the locations, dates, audience, training, reports, and review points in advance. Include a clear way to pause or change the work. Information from the right partner who is in the store can help perfect the pitch and enhance the customer experience with a brand.
The pilot should answer practical questions. Can the team represent the brand clearly? Does the data support decisions? Do store partners accept the model? Can the provider adjust while keeping the message consistent? Your outsourcing partner can help test these and refine them before sales reps are trained.
Goal setting should be part of the first discussion, whether you choose Cydcor or another provider. Define what the team will do, how performance will be reviewed, and what conditions would support expansion.
Retail sales outsourcing can help add customer-facing capacity for product education, market entry, event work, or customer acquisition. The right approach depends on your customer journey, retail environment, operating needs, and risk controls.
Before choosing a provider, confirm that the program has a clear scope, trained representatives, reliable field oversight, defined reporting, and appropriate compliance controls. A focused pilot can also help your team assess the model before a wider rollout.
Ready to explore whether outsourced retail sales support fits your growth goals? Get in touch with Cydcor about your retail customer-acquisition program.

This report on customer acquisition cost by industry uses data drawn from industry benchmark reports, B2B marketing analytics studies, and published third-party datasets covering more than 20 industries. Customer acquisition cost is calculated as total sales and marketing expenditure divided by the number of new customers acquired during a defined period. Using this data, we observe how CAC varies by industry, company size, and acquisition channel, as well as what those variations mean for enterprise organizations when building their growth strategy.
CAC varies by more than 13x across B2B industries,2 reflecting fundamental differences in sales cycle length, competitive density, regulatory burden, and the degree of relationship development required to close a sale. The table below draws on First Page Sage's analysis of client marketing analytics data gathered between January 2022 and August 2025, segmented by organic and inorganic acquisition channels and combined into a weighted average.2
Source: First Page Sage, "Average Customer Acquisition Cost (CAC) By Industry: B2B Edition," January 26, 2026 2
Key findings from this dataset:
The customer segment and ticket size being targeted has as much impact on CAC as the industry itself. Across B2B industries, CAC increases by more than 7x from the small business tier to the enterprise tier, driven by more decision-makers, longer sales timelines, and more complex procurement processes.5 The following table, drawn from First Page Sage's B2B SaaS CAC benchmarks, shows how acquisition cost scales with customer size across 12 industries.3
Source: First Page Sage, "B2B SaaS Customer Acquisition Cost: 2025 Report" 3
Key findings from this dataset:
Not all high CAC is the same. Two industries can share a similar acquisition cost for entirely different structural reasons, and the right response to each is different. The table below maps key industries to the primary factors responsible for their CAC levels, based on analysis of published benchmark research.
"Customer acquisition costs are most meaningful when evaluated alongside customer lifetime value, buying complexity, and growth objectives."
Source: Cydcor research team analysis based on First Page Sage (2026),2 Userpilot (2026),5 and Vena Solutions (2024)12
Key findings from this dataset:
How quickly a company recovers its acquisition investment is as important as the investment itself. An enterprise-level CAC is sustainable when the resulting customer contract generates enough revenue to return that cost within a reasonable timeframe. According to Optifai's Sales Ops Benchmark of 939 B2B SaaS companies, a payback period under 18 months is generally considered healthy, and under 12 months marks best-in-class efficiency.7 The table below draws on First Page Sage's CAC payback benchmarks, based on 50+ SaaS companies tracked over 13 years.4
Source: First Page Sage, "SaaS CAC Payback Benchmarks: 2025 Report" 4
Key findings from this dataset:
No CAC figure is high or low in isolation. A $10,000 enterprise acquisition cost is sustainable when the resulting customer relationship generates $40,000 or more in lifetime value. A $500 CAC is unsustainable when the average customer churns after one transaction generating $400 in margin. The LTV:CAC ratio, which divides customer lifetime value by customer acquisition cost, is the standard tool for evaluating whether a given acquisition program is economically sound. A pattern across published benchmarks indicates around a 3:1 LTV:CAC ratio as the healthy baseline for many B2B businesses.9,10,11
Source: YourGrowthPartner, "Customer Acquisition Cost (CAC) Benchmarks by Industry: 2025 Data" 9
Key findings from this dataset:
CAC benchmarks are more useful as a diagnostic than they are as a destination. Knowing where your industry average sits tells you whether your spend is in range, but not whether your acquisition model is built for the customers you are actually trying to win. The more illuminating questions are whether your CAC reflects your target segment's buying complexity and whether your current channels can reach the decision-makers your deals depend on.
For enterprise organizations in sectors with long sales cycles and high stakeholder counts, the data here points toward a consistent pattern: relationship-driven acquisition often produces lower relative cost and higher customer quality than digital-only approaches, because the buying process requires human contact to advance. Cydcor's outsourced field sales network is built for that environment, delivering a performance-based acquisition model through direct, in-person engagement across North America.
For organizations looking to improve customer acquisition efficiency without sacrificing customer quality, get in touch with Cydcor to learn more.
Last updated: September 2026

Enterprise growth rarely comes from adding more channels at random. It comes from building a customer acquisition process that connects business goals, buyer behavior, execution capacity, and measurable outcomes.
That matters even more as buyers move between digital research, AI tools, sales conversations, events, referrals, and in-person interactions. McKinsey reports that B2B customers now use an average of 10 interaction channels during the buying journey, up from five in 2016.¹
“The strongest enterprise customer acquisition processes align acquisition methods with customer behavior, business goals, and long-term growth.”
This guide explains how enterprise leaders can build a scalable customer acquisition process without overcommitting to any single method.
A customer acquisition process should begin with a concrete outcome by which success will be measured. Enterprise leaders may want to enter a new market, increase market share, acquire higher-value accounts, improve regional coverage, or create a more predictable pipeline.
Each objective requires a different process; A market-entry program may prioritize geographic reach and speed, an account-based program may prioritize stakeholder mapping and opportunity quality, and a volume-focused initiative may emphasize conversion efficiency and repeatable execution.
The objective is then used to determine the criteria for success, including the KPIs that can be used as proof points.
The strongest objectives include a time frame, target segment, revenue expectation, and operating constraint. For example: “Acquire 2,000 qualified business accounts in three regions within 12 months while maintaining a CAC payback period below 12 months.”
Enterprise audiences are rarely single groups. A buying committee may include an executive sponsor, technical evaluator, finance leader, procurement team, and/or an end user. Each person may have different concerns, information needs, and preferred marketing channels.
Build audience definitions around customer behavior rather than demographics alone. Identify the problem each segment is trying to solve, the event that may trigger a purchase, the objections that slow progress, and the evidence required to build confidence.
This buyer journey also determines when human interaction adds value. Gartner found that 69% of B2B buyers prefer to validate AI-generated insights with sales representatives. At the same time, 67% prefer a sales rep-free experience, and 70% prefer a fully digital, self-service experience.²
These findings support a balanced process. Digital content can help buyers research independently, while skilled representatives can provide context, reassurance, and decision support at critical moments.
No single acquisition channel performs equally well across every segment, market, or growth stage. A scalable process assigns each channel a clear job and/or a conditional use case.
Owned channels (such as search, email, and educational content) can support efficient research and demand capture. For example, paid media can accelerate reach when targeting and conversion paths are clear while partners and referrals can transfer trust. Account-based outreach can focus resources on high-value prospects and Events and in-person acquisition can create direct conversations where products require explanation, local presence, or relationship-building.
Cydcor’s model illustrates how relationship-driven acquisition can fit into a broader strategy. The company describes customer acquisition programs across B2B field sales, retail, events, and residential outreach, supported by a network of hundreds independently owned sales companies.³ That makes in-person acquisition a flexible component for specific audiences and objectives, rather than a replacement for digital or owned channels.
Evaluate channels using the same commercial standards. Compare qualified opportunities, conversion rates, sales-cycle length, CAC, customer quality, and payback period across each one of them, and think critically about what you find. A channel that produces fewer leads may still be the better investment if it produces higher-value customers, as long as your initial objective doesn’t necessitate a high volume of new customers.
A strategy becomes a process when people can execute it consistently. Define how campaigns are planned, launched, monitored, improved, and expanded and ensure individual roles and scope are clear.
Your operating model should establish ownership across marketing, sales, finance, operations, legal, and customer success, and should also document handoffs. A campaign can generate strong demand but still underperform if leads are not routed quickly, representatives lack the right training, or customer data does not flow back into the CRM. Documentation of handoffs can help identify where in the process either the operating model, or your staff’s understanding of their role within it, intervention may be needed.
For enterprise programs, governance is part of growth. Brand standards, consent practices, reporting rules, and escalation paths should be designed before launch. This is especially important when multiple teams, agencies, territories, or local operators represent the same company, or when outsourced sales is on the table.
A mature customer acquisition process measures more than activity. Impressions, meetings, and leads can help diagnose or predict performance, but they do not prove profitable growth on their own.
Create a measurement framework that links channel activity to pipeline, closed revenue, retention, and expansion. Then, segment results by audience, geography, product, campaign, and acquisition source. This helps leaders see where performance is strong and where a blended average is hiding problems.
Review results at three levels:
The goal here is to identify the combination of channels and operating practices that produces durable growth.
An effective enterprise customer acquisition process gives every channel a defined role. It begins with business objectives, reflects how target buyers make decisions, includes the right mix of digital and human interactions, and uses consistent measurement to guide investment.
For organizations that need to expand market coverage, reach difficult-to-access prospects, or add relationship-driven acquisition capacity, Cydcor offers in-person customer acquisition programs designed to work alongside broader go-to-market strategies.³ ⁴
Explore Cydcor’s Customer Acquisition Services

Enterprise brands rarely grow by relying on one customer acquisition channel. The harder question is how those channels should work together.
Multichannel marketing uses several channels to reach customers, but each channel may operate independently. Omnichannel marketing, on the other hand, connects those channels so customers experience one coordinated journey across digital, physical, and in-person touchpoints.¹
The difference matters when a prospect moves from a paid ad to a website, speaks with a sales representative, visits a retail location, or responds to an event promotion. A multichannel strategy can create reach, while an omnichannel strategy connects that reach to a more consistent customer experience.
The omnichannel marketing vs. multichannel marketing comparison begins with a company’s priorities for their marketing campaign. Multichannel focuses solely on being present across as many platforms as possible, while omnichannel marketing focuses on what happens as customers move between those platforms.
A multichannel program might use email, social media, paid search, retail, and field sales at the same time, but each channel may have its own goals, audience segments, reporting, and creative direction.
That structure can be useful, since teams can test channel-level performance without waiting for complete data or technology integration. However, customers may receive inconsistent messages or repeat information when they switch channels.
An omnichannel model treats those interactions as connected parts of one journey to turn all marketing touchpoints into a continuous, unified customer experience.¹ This should be the eventual end-goal of any comprehensive marketing campaign.
Both strategies can support customer acquisition, but their strengths differ in how they manage the relationship after the first interaction.
Multichannel marketing is often the simpler and more cost-effective starting point for organizations building channel coverage. It can help a brand identify where prospects respond, which messages perform, and which markets deserve more investment before creating a ground-up strategy that forces commitment.
Omnichannel marketing becomes more valuable as the buying journey becomes more complex. Customers may research online, ask questions through a sales team, compare options in person, and complete the purchase through a different channel. This makes it prudent to consider what stage in that buyer journey each marketing channel most often plays a role, and how it impacts the likelihood of an eventual purchase.
McKinsey notes that effective omnichannel marketing integrates channels around customer preferences and needs. Its research also links successful omnichannel personalization with a potential 5% to 15% revenue increase across the customer base.² This stresses the idea that it isn’t just about increasing visibility across channels, but coordinating that visibility in a way that puts the buyer journey on the path to a sale.
In-person acquisition is not the opposite of digital marketing. It can serve as the human interaction that makes a broader omnichannel journey more useful.
A prospect may see a digital ad but still need a product explanation, a live demonstration, or an answer to a specific objection. Face-to-face engagement can provide those interactions in real time.
The strongest omnichannel programs define how in-person teams connect with digital activity before, during, and after each interaction.
For example, an enterprise brand could use digital media to promote a service in a target market, then use trained representatives at retail locations or events to engage interested prospects. This allows follow-up communications to continue the conversation instead of treating the interaction as an isolated event, and offers in-person sales reps warmer leads.
McKinsey identifies physical and digital coordination as a major part of omnichannel personalization. It also emphasizes the need to connect digital and physical footprints and align frontline teams with the broader customer experience.³
Enterprise growth rarely comes from relying on a single channel. Face-to-face customer acquisition complements digital marketing by creating direct customer interactions that strengthen an omnichannel strategy.
The right choice depends on the organization’s objectives, data maturity, and customer journey.
Prioritizing multichannel marketing does not mean ignoring customer experience. It means establishing a focused presence before connecting every touchpoint.
Prioritizing omnichannel marketing does not mean using every available channel. It means choosing the channels that matter to the customer and connecting them around clear journey stages.
Enterprise brands should also avoid treating omnichannel as solely a technology project. It requires shared goals, consistent messaging, reliable reporting, and teams that understand how their interactions affect the next step.
Start with the journey instead of a channel list. Identify the moments when customers discover the brand, evaluate an offer, request information, speak with a representative, and decide whether to move forward.
Then, it’s time to define the role of each touchpoint.
Cydcor’s campaign process begins with understanding a client’s business goals, target customers, geographic priorities, compliance requirements, and success metrics. Cydcor then matches campaigns with sales companies based on market coverage and relevant experience.
That type of structure can help enterprise brands add face-to-face acquisition without creating a disconnected side program. In-person teams become part of the customer journey, while digital channels support awareness, follow-up, measurement, and retention.
Multichannel marketing helps enterprise brands reach customers across several platforms. Omnichannel marketing goes further by connecting those interactions into a more consistent journey.
The strongest strategy may use both. A brand can begin with focused multichannel testing, then connect high-value touchpoints as customer movement, data, and operational needs become clearer. Face-to-face acquisition adds a valuable human layer, particularly when customers need explanation, trust, or real-time guidance.
Cydcor helps enterprise brands build in-person customer acquisition programs across B2B field sales, retail, events, and residential outreach. Those programs can complement digital marketing and support a broader omnichannel growth strategy.
Talk with Cydcor about your customer acquisition goals

Cydcor recently sat down with Andy King, President of Federal Publications Seminars (FPS), FPS is a leader in federal contracting compliance training with over 65 years of experience, hundreds of trusted industry experts, and the largest content library in market. At Cydcor, we connect leading brands with customers through face-to-face sales campaigns, and compliance monitoring is built into how every campaign is managed. Few markets demand more compliance discipline than government contracting. So we asked Andy what regulated industries can teach any organization that wins business on trust.
Q: You teach government contractors how to stay compliant. Why should sales-driven organizations pay attention?
A: Because compliance determines who is allowed to compete. In government contracting, a company that cannot demonstrate compliance with the Federal Acquisition Regulation, or FAR, cannot win the contract. The same dynamic exists in telecom, home services, energy, and financial products. Buyers choose partners that can prove they follow the rules, and regulators can remove you from the market if you cannot. Compliance is not overhead. It is necessary to sell.
Q: From what you have seen in government contracting, what separates companies that treat compliance as an advantage from those that treat it as a checkbox?
A: Among the contractors we work with at Federal Publications Seminars, three habits stand out. They train continuously instead of once a year, because regulations change faster than an annual refresher can capture. They push knowledge to the people making frontline decisions rather than keeping it inside the legal department. And they document everything, because regulators consistently distinguish between a compliance program that exists on paper and one that demonstrably works. None of that is unique to government contracting. It is simply what disciplined organizations tend to do.
Q: Federal rules are changing quickly right now. How does Federal Publications Seminars keep the contractors it trains current?
A: This is the busiest regulatory period we have seen in decades. The federal government has proposed rewrites to large portions of the FAR, and agencies are already operating under deviations while those rules are finalized. At Federal Publications Seminars, our team tracks the Federal Register, agency supplements, and case law, and we update our curriculum as each change lands. That is our job, and we have been doing it for government contractors for more than 65 years. The transferable lesson for any organization is simpler: someone has to own regulatory change, or every change becomes a surprise.
Q: Cydcor’s model is built on human connection. Does compliance ever conflict with relationship-driven selling?
A: It strengthens it. Face-to-face selling works because the customer trusts the person in front of them. A representative who knows the rules can answer hard questions on the spot, set accurate expectations, and avoid promising anything the company cannot deliver. We see the same pattern in government contracting: the contractors with the strongest compliance reputations are the ones who get invited back. Trust compounds. Compliance is how you protect it.
Q: What is your advice for leaders who want to build that discipline into their organizations?
A: Start with roles, not rules. Map what each role must know to do its job compliantly, and train to that map. Choose accredited training where it exists, because accreditation forces rigor. Then measure application rather than attendance: can your people spot the issue when it appears in real work? Organizations that operate this way stop treating compliance as a cost center. It becomes part of how they win.

A Structured Framework for Evaluating Outsourced Sales and Customer Acquisition Partners
"A structured RFP helps organizations evaluate customer acquisition partners more consistently and objectively."
Selecting a customer acquisition partner is a high-stakes decision. The wrong choice can damage your brand, waste acquisition budget, and delay growth by months. The right partner should function as a trusted extension of your go-to-market team, one that delivers measurable results, protects your brand in every customer interaction, and scales with your business.
There is no one-size-fits-all program: the right partner should be able to tailor its approach to your brand, industry, and target markets rather than applying a single standard playbook to every client.
This template gives procurement teams, VP-level buyers, and cross-functional evaluation committees a consistent framework for issuing, scoring, and comparing proposals from outsourced customer acquisition providers. It covers six critical evaluation categories: company experience, service delivery, scalability, reporting, governance, and commercial terms.
Complete the bracketed fields in each section before distributing to prospective providers. Use the scoring matrix in the next section to evaluate responses against a standardized rubric.
This template is appropriate for organizations that are:
This matrix gives your evaluation team a single-view summary of what matters most and how to weight each category during scoring. Assign weights based on your organization's priorities before distributing the RFP.
Scoring Guide:
Note for evaluators: Weigh governance and brand compliance at a minimum of 10% regardless of budget pressure, or even as a pass/fail criterion. A provider who cannot demonstrate consistent brand protection is a liability at any price point.
Complete this section before distributing the RFP. Prospective providers use this context to tailor their proposals to your specific situation.
Issuing Organization: [YOUR COMPANY NAME]
Primary Contact: [NAME, TITLE, EMAIL, PHONE]
RFP Issue Date: [DATE]
Proposal Submission Deadline: [DATE]
Anticipated Program Start Date: [DATE]
Program Scope: [Brief description of the customer acquisition challenge you are solving]
Target Geographies: [List states, regions, or markets you need covered]
Target Customer Segments: [Describe the customers you need acquired: residential, SMB, enterprise, etc.]
Industries Served: [Your company's industry and the industry of your end customers]
Annual Acquisition Volume Target: [Number of new customers you expect to acquire per year]
Current Acquisition Channels in Use: [List existing channels: digital, direct mail, in-person, etc.]
Evaluation Timeline:
This section evaluates whether the provider has the institutional depth, industry knowledge, and client history to serve your organization at scale.
Instructions to Vendors: Provide complete, verifiable responses to each question. Include supporting documentation such as case studies, client references, or certifications where indicated.
This section evaluates the provider's day-to-day operational capabilities: how they recruit and train representatives, manage campaign quality, and protect your brand in the field.
The B2B sales outsourcing services market is projected to reach $20.5 billion by 2033¹, driven in part by enterprise demand for scalable acquisition capacity. This section evaluates the provider's capacity to grow your program, enter new markets, and flex volume without compromising quality or brand standards.
A customer acquisition partner who cannot provide clear, timely performance data cannot be managed effectively. This section evaluates the provider's reporting infrastructure and commitment to transparency. More than 75% of organizations report that buyers expect faster, more personalized responses from vendors².
Brand protection is non-negotiable. This section evaluates the provider's governance infrastructure, compliance standards, and the controls they use to ensure every customer interaction reflects your brand's standards.
This section evaluates the financial structure of the engagement. Performance-based pricing models are the standard for high-quality outsourced customer acquisition providers and protect enterprise buyers from paying for volume without quality.
Q: How is an outsourced customer acquisition partner different from a staffing company?
A: A staffing company is generally limited to filling headcount. A staffing partner that is also a customer acquisition partner provides a complete operational system: staffing, campaign management, brand compliance oversight, performance reporting, and ongoing optimization. The distinction matters at the governance and accountability level because with a true partner, you have structured performance commitments rather than simply filling a roster.
Q: Should we run a pilot before committing to a full-scale program?
A: Yes, for most enterprise buyers, a pilot is the lowest-risk path to validating a new partner, and enables refinement before launching a full-scale program. A credible provider should support a defined pilot period, typically 60 to 90 days, in a limited set of markets with agreed-upon success metrics before a full rollout commitment. Ask prospective providers specifically what their pilot program structure looks like and what triggers expansion.
Q: What is a realistic timeline from contract execution to active customer acquisition?
A: Timelines vary based on how customized the program needs to be, and generally, more customization requires more time. However, working with a provider that regularly builds tailored programs, rather than applying a single standard playbook, can significantly compress that timeline. For enterprise programs using existing training materials and established brand guidelines, experienced providers can support representative activity within weeks of contract execution. Full program rollout timelines depend on geographic scope, volume targets, and the provider's experience delivering customized programs.
Q: How do we protect our brand if a field representative behaves improperly?
A: Include explicit brand conduct standards and a complaint resolution SLA in the contract. Ask each prospective provider for their documented complaint handling process and the average resolution time for conduct-related complaints. Request references specifically from clients who have experienced a compliance incident to understand how the provider responded.
Outsourced customer acquisition is one of the highest-leverage decisions a growth-stage or enterprise brand can make. The difference between a rigorous selection process and an ad hoc one often determines whether a program delivers strong returns or requires a painful replacement cycle one year in.
This template gives your team a consistent framework for asking the right questions, scoring responses objectively, and protecting your brand throughout the evaluation process. The seven sections above cover the criteria that consistently separate high-performing outsourced acquisition partners from providers who look competitive on paper but fail to deliver at scale.
When you are ready to benchmark a specific provider, Cydcor has served Fortune 500 companies and emerging brands across North America for more than 30 years, delivering face-to-face customer acquisition through a network of independently owned sales companies. Cydcor was named the 2026 Silver Stevie® Award Winner for Sales Outsourcing Provider of the Year, selected by more than 150 senior judges from over 2,100 nominations worldwide.³
Sources

Many enterprise growth teams treat field marketing and demand generation as two distinct phases: first, you create awareness, then you send someone to close. That framing is somewhat outdated, as effective customer acquisition strategies run both strategies at the same time, collapsing the distance between the first impression and the signed contract.
Understanding field marketing vs. demand generation, how each individual discipline actually works, and where they overlap can often be the difference between a pipeline that stalls and one that compounds. Demand generation builds awareness and interest across a broad audience using digital channels. Field marketing engages high-value prospects directly, in person, to accelerate and close the sale.
The direct comparison reflects a clean separation, but in practice, high-performing field teams do not simply pick up where demand gen leaves off.
A savvy field rep creates interest, handles objections, and closes the deal inside a single conversation, executing what many organizations model as three separate funnel stages simultaneously.
Demand generation is the practice of building systematic interest in your brand or solution across a target market. It uses content, paid media, SEO, and email nurture to reach a broad audience, move buyers through an awareness and education phase, and surface intent signals for sales to act on. According to Content Marketing Institute 2026 data, B2B buyers consume an average of 13.4 pieces of content before contacting a vendor, and 67% of the buying journey is now self-directed.¹ Demand gen provides the fuel for that self-directed journey.
Field marketing operates closer to the point of decision. Rather than waiting for a prospect to raise their hand, a field team takes the message directly to the customer: at their home, their business, a retail location, or an event. The interaction is live, two-way, and personal. Questions can get answered in real time, trust can build faster, and the decision can happen on the spot.
Misalignment between these two disciplines often comes down to KPIs that do not speak the same language. Demand gen teams optimize for cost-per-lead and MQL volume while field teams measure customers acquired and close rate. When both report to different leaders using different scorecards, coordination can break down.
Healthy programs bridge the two by defining shared goals at the customer acquisition level. That means demand gen is accountable not just for leads delivered, but for the quality of the territory intelligence and prospect profiles that field teams need to execute efficiently. Field teams, in turn, feed conversion data back upstream to sharpen targeting and content.
"Field marketing and demand generation are most effective when aligned around shared customer acquisition goals."
The conventional model treats demand generation as upstream and field marketing as downstream. That model assumes a prospect needs multiple digital touchpoints before they are ready to speak with someone in person. For many enterprise sales cycles, that is accurate. But for high-volume consumer and SMB acquisition, it is often unnecessary, and it introduces delay.
A well-trained field rep arriving at a prospect's door, retail location, or business is not just closing a lead that demand gen warmed up. They are generating demand in the moment: introducing the problem, framing the solution, demonstrating value, and converting, all within the same interaction. This is not a shortcut. It is a different model of the buying journey, one where a face-to-face conversation replaces the drip sequence.
Program design suffers when brands deploy field teams expecting them to only work 'warm' leads. The most productive field programs work both sides: generating genuine interest from cold contacts while simultaneously closing the prospects who were already familiar with, or considering, products in the market.
Executing field marketing at enterprise scale requires territory coverage, compliance management, and performance reporting across dozens of markets at once. Cydcor provides access to that infrastructure through one of North America's largest networks of independently owned sales companies, connecting Fortune 500 and emerging brands to customers across residential, retail, B2B, and event channels throughout most major North American markets.
What makes Cydcor's model distinct is that demand generation and field sales processes are not separate; they can often happen in the same conversation. A field rep from our network is not building awareness and handing off; they can introduce the brand, qualify the prospect, and close the customer in a single interaction. This is not field marketing as a precursor to sales. It is field marketing that is the sale. Recognized as DIRECTV Dealer of the Year for 10 consecutive years (2016–2025), Verizon's 2025 ACD Wireless Agent of the Year, and an Inc. 5000 honoree in both 2025 and 2026, Cydcor's track record reflects what that model delivers at scale.²
“Field marketing vs. demand generation” really isn’t referring to competing priorities, but to complementary forces that, when aligned around shared acquisition goals, can accelerate every stage of the buying journey. Many effective enterprise growth programs stop treating them as sequential and start running them in parallel. For brands that need field execution at scale, the right partner does not just support demand generation; they generate demand and convert it simultaneously.
Cydcor can help turn market opportunities and leads into sales across retail, residential, and B2B channels. Whether entering a cold territory, converting warm leads, cross-selling new products to existing customers, or supporting retention and renewals, Cydcor’s field teams create demand and advance customers toward action in the same interaction.
Explore a partnership with Cydcor to build a field sales program tailored to your customer acquisition goals
Sources
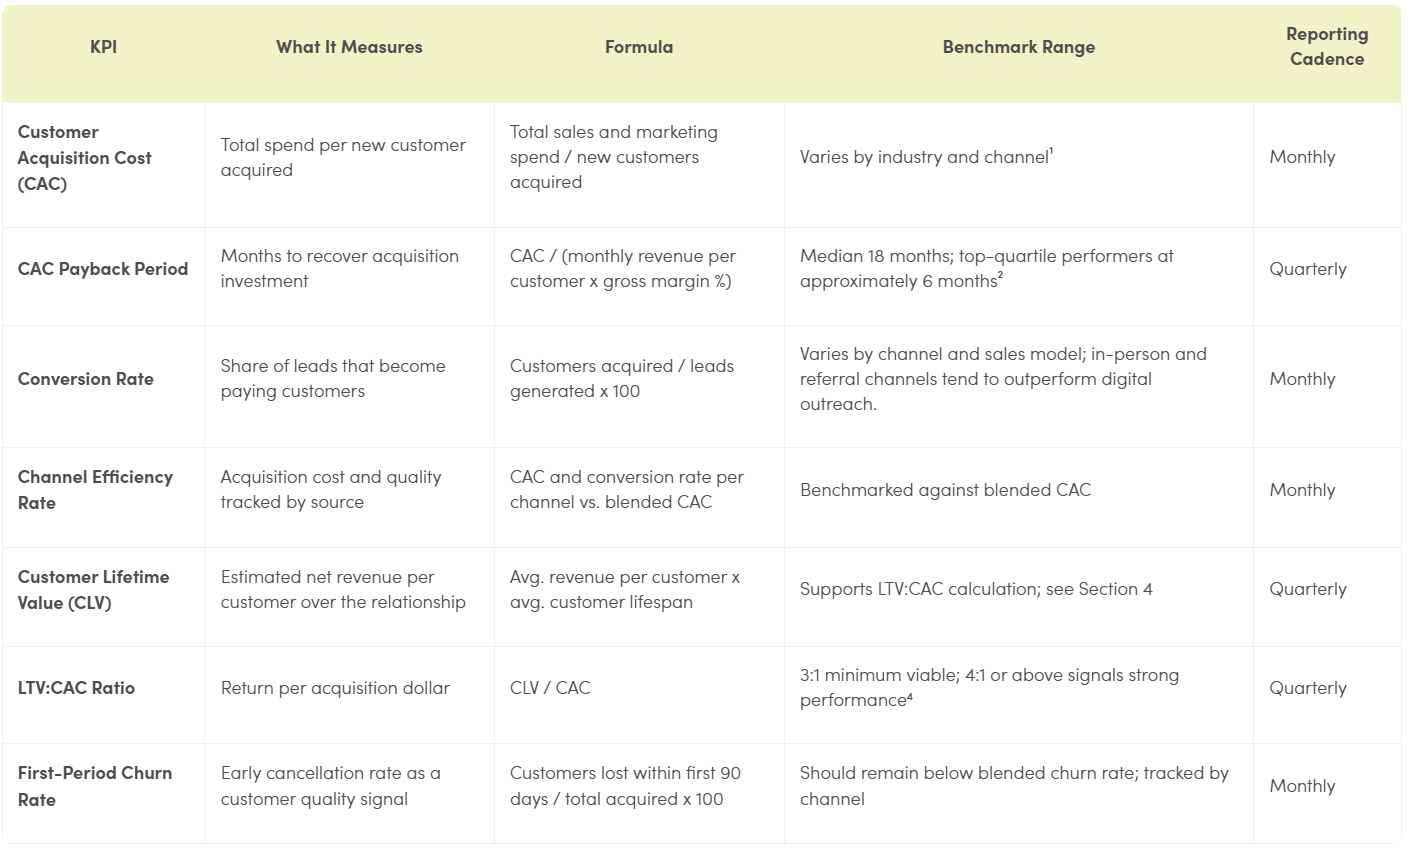
Many acquisition reporting tracks the wrong things. Leads generated, clicks, and impressions describe channel activity, not customer outcomes. The customer acquisition KPIs in this framework connect spend to business results, covering cost efficiency, conversion quality, channel performance, and long-term customer value.
The seven KPIs below cover the full acquisition measurement picture, from upfront cost and channel efficiency to conversion quality and long-term customer value.
Benchmark ranges reflect published industry research cited in each section. Individual benchmarks vary by industry, sales model, and customer segment.
The right customer acquisition KPIs measure business outcomes, not just marketing activity.
CAC measures total spend per new customer, calculated by dividing sales and marketing spend by the number of new customers acquired in a given period. Many teams track two versions: blended CAC, which averages cost across all channels and gives a top-line efficiency view, and channel-specific CAC, which isolates performance by acquisition source.
Blended CAC tells you what you are spending overall. Channel-specific CAC tells you where that spend is and is not working. Both figures become more useful when compared against an industry baseline. The table below shows average B2B CAC benchmarks across seven industries, drawn from First Page Sage's analysis of client analytics accounts between January 2022 and August 2025.¹
Average B2B Customer Acquisition Cost by Industry — 2026¹
Organic CAC reflects primarily SEO and organic social. Paid CAC reflects primarily PPC/SEM and paid social. Combined average is weighted 75% organic and 25% paid, consistent with the reporting methodology of the underlying dataset.
In most tracked industries, organic CAC runs below paid CAC, though the gap varies meaningfully by sector and organic channels typically require sustained investment before the efficiency advantage compounds.¹
CAC Payback Period measures how many months it takes to recover the cost of acquiring a customer. It is calculated by dividing CAC by monthly revenue per customer, adjusted for gross margin.
Benchmarkit's 2025 SaaS Performance Metrics data found the median CAC Payback Period is 18 months, with top-quartile companies from the same dataset achieving payback closer to 6 months.² That gap likely reflects a not insignificant difference in customer quality, channel mix, and pricing structure.
Channel-specific CAC tracking is what makes blended CAC actionable. If blended CAC is rising, channel-level data is where you identify which source is driving it.
Cost per lead (CPL) is a precursor to CAC, not a substitute. What a channel costs per lead does not reflect what it costs per customer acquired, since conversion rates vary significantly by source. Exhibit Surveys benchmarks structured in-person event programs at an average of $112 CPL,⁵ compared to $66.69 across all industries for paid search³ and $259 for traditional cold field outreach.⁵ A lower CPL does not produce a lower CAC if the channel converts at weaker rates or produces customers who cancel early.
Conversion rate measures the share of leads that become paying customers. It is most useful when tracked at two levels: lead-to-opportunity and opportunity-to-customer. Reporting only on the final number can mask problems that are better addressed at different stages of the acquisition process.
Conversion rate is also channel-dependent. A blended rate obscures meaningful variation across sources. A blended 4% conversion rate, for example, may reflect a significantly higher rate from in-person and referral channels combined with a lower rate from cold digital outreach. Channel-level tracking surfaces those differences.
A channel that converts at high rates but produces customers who cancel within 90 days creates a measurement problem rather than a true growth asset. First-period churn rate and first-period retention rate are the primary signals that conversion quality is holding after the sale.
A rising first-period churn rate, particularly when acquisition volume is flat or growing, typically indicates a customer fit issue at the point of acquisition rather than a product failure. Channel-level tracking of first-period churn is the mechanism that identifies which sources are driving the problem.
Some enterprise teams also track Campaign Quality Rate, defined as the percentage of acquired customers who meet defined quality criteria at 90 days, typically combining retention, revenue contribution, and engagement signals. This metric is organization-defined and most useful as a trend tracked over time by channel, rather than against a fixed external benchmark.
Conversion and First-Period Quality by Acquisition Channel
Research Insights:
CLV measures the estimated net revenue a customer generates over the duration of the relationship. CLV and LTV refer to the same metric and are used interchangeably across most reporting frameworks. Tracked in isolation, CLV informs pricing models and revenue projections. Compared against CAC, it becomes an acquisition efficiency metric.
A high CLV alongside a high CAC may or may not indicate a sustainable acquisition model. The LTV:CAC ratio is what determines whether acquisition spend is generating durable returns over time.
LTV:CAC measures the return generated per acquisition dollar. Industry benchmarks treat 3:1 as the minimum viable ratio, meaning a customer should generate at least three times what it cost to acquire them.⁴ Ratios of 4:1 or above are considered a signal of strong acquisition performance.⁴
LTV:CAC differs from the New CAC Ratio used in SaaS performance benchmarks, which measures sales and marketing spend relative to new ARR. Both are useful, but they answer different questions: LTV:CAC measures total value returned over the customer relationship; New CAC Ratio measures spend efficiency at the point of acquisition.
LTV:CAC can improve through two levers: lowering CAC or increasing CLV. Acquisition channel choice affects both. Channels that produce higher-quality customers tend to sustain stronger ratios even when upfront CPL is higher, because lower early churn extends the customer relationship and the revenue it generates.
LTV:CAC Ratio Benchmarks by Industry — 2025⁸
Data compiled from client analytics between 2019 and 2024; 74% from B2B firms. CAC figures in this table reflect a blended average across acquisition channels and may differ from the organic/paid breakdown in Section 2.
Research Insights:
Teams that track customer acquisition KPIs across all four categories — cost, payback, conversion quality, and long-term customer value — tend to make more defensible channel decisions and identify acquisition quality problems before they compound into retention problems. The KPIs in this framework are designed to provide that visibility across the full acquisition cycle, not just at the point of lead generation.
Cydcor connects enterprise brands to in-person acquisition programs through a network of independently owned sales companies, with a focus on strategies that bring in quality customers brands can retain and grow relationships with.
For brands building a more measurable, outcome-oriented approach to customer acquisition:
[Tech note: Please display sources but keep section collapsible]
¹ First Page Sage. "Average Customer Acquisition Cost (CAC) by Industry: B2B Edition." January 2026. firstpagesage.com/reports/average-customer-acquisition-cost-cac-by-industry-b2b-edition-fc/
² Benchmarkit. "2025 B2B SaaS Performance Metrics Benchmarks." 2025. benchmarkit.ai/2025benchmarks
³ WordStream. "Google Ads Benchmarks 2026: Competitive Data and Insights for Every Industry." May 2026. wordstream.com/blog/2026-google-ads-benchmarks
⁴ SaaSHero. "Best LTV to CAC Ratio Benchmarks for B2B SaaS in 2026." saashero.net/strategy/b2b-saas-ltv-cac-benchmarks/
⁵ Exhibit Surveys, Inc. Trade show and field sales CPL benchmarks. exhibitsurveys.com/research
⁶ Roghanizad, M. and Bohns, V. (2017). "Ask in person: You're less persuasive than you think over email." Journal of Experimental Social Psychology, 69, 223–226. ecommons.cornell.edu/server/api/core/bitstreams/2dd2f22c-265c-4e73-b4a8-c6f4f19662e8/content
⁷ EventMarketer. EventTrack 2018 Executive Summary. eventmarketer.com/wp-content/uploads/2018/06/eventtrack2018execsumm.pdf
⁸ First Page Sage. "The LTV to CAC Ratio Benchmark." June 2025. firstpagesage.com/seo-blog/the-ltv-to-cac-ratio-benchmark/
⁹ Schmitt, P., Skiera, B., and Van den Bulte, C. (2011). "Referral Programs and Customer Value." Journal of Marketing, 75(1), 46–59. faculty.wharton.upenn.edu/wp-content/uploads/2012/04/Schmitt-Skiera-vandenBulte-2011-Referral-Programs-Customer-Value.pdf
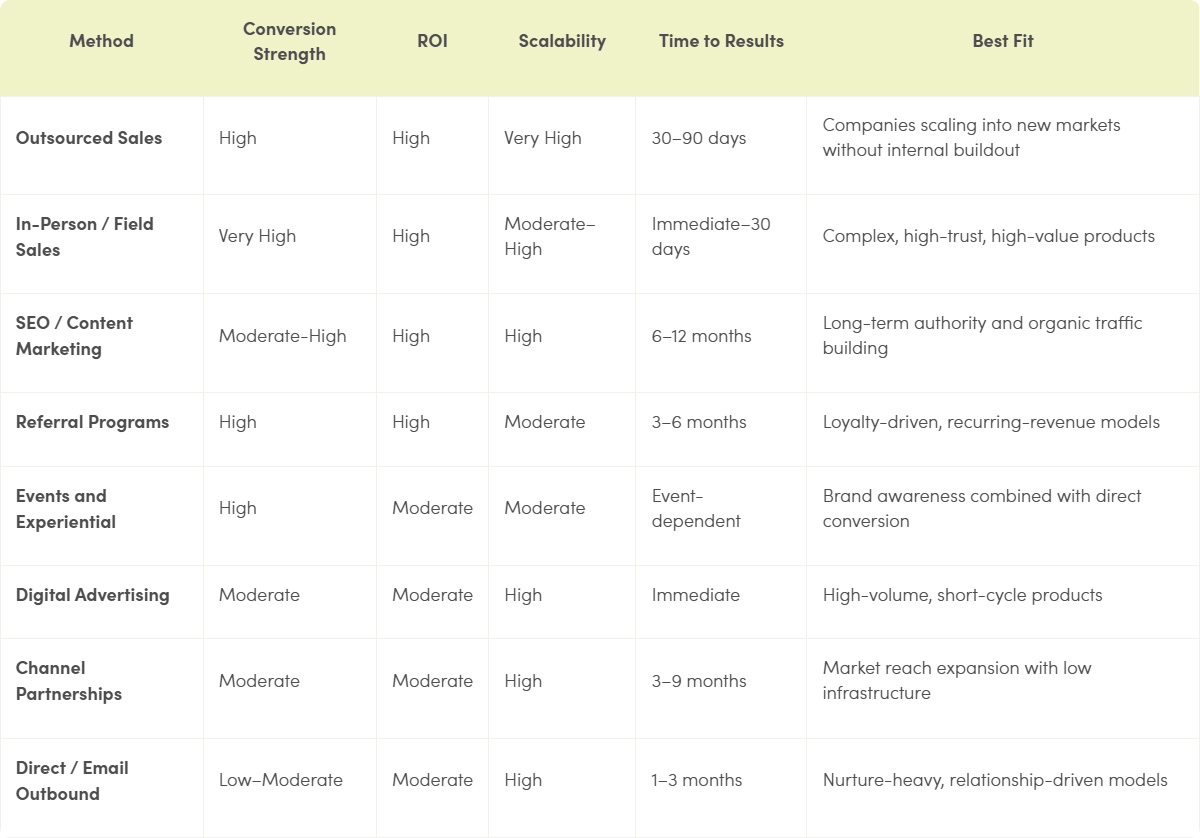
Growing a customer base requires more than picking a channel and hoping it performs. Organizations that scale consistently approach acquisition strategically, evaluating multiple methods against their target audience, sales cycle, and growth stage. Customer acquisition costs (CAC) have surged roughly 60%10 over the last decade, making channel selection a genuine competitive advantage rather than a secondary consideration. Customer acquisition can work across channels (B2B, residential, retail, events, etc.), which can make allocating these costs more complex.
This piece examines the most common customer acquisition methods used by growing businesses, compares their strengths and limitations, and explains how companies that align their channel mix with customer behavior consistently achieve better long-term results.
Sources: First Page Sage B2B CAC Report (2026); Baremetrics; EntrepreneursHQ Referral Marketing Statistics; GrowLeads.io (2025)
"The most effective customer acquisition strategies combine multiple channels to create sustainable and measurable growth."
Outsourced sales programs allow organizations to expand into new markets at speed without building an internal field team from the ground up. Outsourced sales operations typically reduce operating costs by 30–50% compared to equivalent in-house teams and deliver 63% faster lead response times due to existing infrastructure and specialization. For companies entering new geographies or verticals, outsourced sales can compress time-to-market from months to weeks in many cases. The performance-based structures available through outsourced field sales networks typically tie cost directly to customer acquisition outcomes, reducing financial risk during expansion.
The critical advantage outsourced sales holds over other channel-expansion models is control. Unlike channel partnerships, outsourced sales programs are built around a single client's acquisition goals, compliance requirements, and brand standards, so customer interactions reflect the company's expectations. Outsourcing is also a great way to introduce a new brand or product that hasn’t yet been introduced in-person without having to build out a full in-house sales team. Cydcor delivers one of the market’s most scalable customer acquisition models through its North American network of independent sales companies, largely for this exact purpose.
Best fit: Companies scaling into markets without internal buildout, rolling out new products in existing markets, and/or looking to support core sales teams
In-person customer acquisition is essentially the in-house version of outsourced sales, so it remains one of the highest-conversion methods available; this is especially true for products that benefit from direct explanation, relationship building, or consultative selling. Face-to-face interaction removes barriers that digital channels generally cannot address: real-time objection handling, physical product demonstration, and the trust established through direct human contact. Digital advancements have reframed in-person selling as a premium tier of engagement, not an outdated one. For telecommunications, energy, home services, and SMB-targeted products, field-based programs routinely outperform digital channels on conversion rate per qualified interaction.
Field-based programs execute across four primary channels: B2B direct outreach, retail environments, live events, and residential outreach. A key downside of doing this in-house, as opposed to outsourcing, is the higher cost and lower flexibility when compared to accomplishing the same thing through an outsourced partner. This model allows brands to deploy in-person acquisition at a scale that in-house teams rarely match without significant infrastructure investment.
Best fit: Complex, high-trust, high-value products
Organic content builds long-term acquisition infrastructure rather than renting it. Organic CAC benchmarks run significantly below paid alternatives across nearly every B2B sector, and the value compounds as content earns authority over time. Organic-dominant brands report 41% lower median customer acquisition cost and a higher lifetime-value-to-acquisition-cost ratio compared to paid-heavy competitors. The tradeoff is time: meaningful SEO results typically take six to twelve months to materialize. Organizations that treat content as a core investment rather than a campaign tactic tend to benefit most.
Best fit: Long-term authority and organic traffic building
Referral programs leverage one of the most reliable signals in sales: a trusted recommendation. Referred leads tend to convert at four times the rate of cold leads, and companies with structured referral programs report 24% lower overall customer acquisition costs. Referred customers also tend to demonstrate higher retention, with one analysis reporting 59% higher lifetime value compared to non-referred customers. The limitation is dependency: referral programs require a healthy existing customer base, so they are more powerful as an amplifier of other acquisition work than as a standalone foundation.
Best fit: Loyalty-driven, recurring-revenue models
Events and experiential programs place sales-trained representatives directly in front of prospects at trade shows, brand activations, retail sampling programs, and street team campaigns. The conversion advantage comes from the same source as field sales: real-time, face-to-face engagement that allows immediate objection handling and product demonstration. The ROI profile is moderate rather than high because upfront costs, including staffing, logistics, and event fees, are concentrated before a single customer is acquired. Event staffing programs can perform best for brands when teams are built to sell, not just represent. Passive brand coverage produces impressions, but this type of active sales engagement produces customers.
Best fit: Brand awareness combined with direct conversion
The clear advantage of paid digital channels, including pay-per-click search advertising and paid social, is speed. Campaigns can go live within days and generate leads almost immediately, making them useful for product launches or seasonal campaigns. However, the cost profile can be significantly greater than organic acquisition channels. Organic CAC consistently beats inorganic CAC across virtually every B2B industry tracked by First Page Sage, with inorganic channels running 40–175% higher depending on the sector. Competition for high-intent keywords continues to intensify, and some industries now report year-over-year paid CAC increases above 15%. For companies without optimized landing pages and strong conversion infrastructure, paid advertising may generate traffic without generating customers.
Best fit: Brand awareness combined with direct conversion
Channel partnerships allow companies to distribute their product or service through third-party resellers, agencies, or strategic allies. They require minimal infrastructure investment and can unlock broad market reach quickly. The tradeoff is limited control: channel partners carry multiple brands and prioritize their own commercial interests. This makes partnerships effective as a market-reach layer rather than a primary acquisition engine.
Best fit: Brand awareness combined with direct conversion
Direct outreach and email campaigns can offer the lowest cost per contact of any acquisition channel and scale easily across large prospect lists. Conversion rates are lower than those of inbound or in-person methods, with cold email conversions averaging well below 5% in most B2B contexts. The channel performs best when applied to warm prospects, existing lead nurture sequences, or re-engagement campaigns rather than cold-market expansion. For organizations with strong CRM infrastructure and a defined ideal customer profile, direct outbound can function as a cost-efficient complement to higher-conversion channels rather than a primary acquisition engine.
A major limiting factor for direct and email outbound marketing are modern automated email filtering tools becoming standard features of most email hosts (Gmail, Yahoo, etc.). This is why, despite its low cost, email marketing is more of a lead nurturing tool than a lead generation tool.
Best fit: Nurture-heavy, relationship-driven models
No single customer acquisition method fits every business at every stage. Early-stage companies often rely on direct outreach and referrals to prove unit economics before investing in paid channels. Mid-stage companies typically layer in content marketing and channel partnerships to build compounding returns. Organizations at scale, particularly those expanding into new geographic markets or customer segments, frequently add outsourced field sales to execute volume acquisition without the overhead of internal team buildout.
Three variables tend to drive channel selection most reliably:
Companies that align customer acquisition methods with these variables tend to achieve both stronger conversion rates and lower blended CAC over time.
Selecting customer acquisition methods is not a one-time decision. It is an ongoing calibration based on cost performance, market feedback, and growth objectives. Organizations that achieve durable growth tend to run multi-channel acquisition programs, treating in-person and field-based engagement as a core component rather than a fallback option.
A clear frontrunner for flexible, high-ROI customer acquisition is outsourced sales. When field acquisition is delivered through a structured outsourced mode like this, it combines the conversion strength of direct human engagement with the scalability of a professional organization and a network built specifically for that purpose. Cydcor offers both outsourced field sales and event staffing for businesses that need it.
Learn how Cydcor's Field Sales Network can support your customer acquisition goals.

Successful retail brand ambassadors do far more than demonstrate products or hand out samples. They create meaningful customer experiences, represent brands professionally inside retail environments, and directly influence purchasing decisions. But showing up inside a retailer's environment and actually succeeding there are two different things. Retail brand ambassador work demands a specific combination of skills, professional habits, and situational awareness that most brands underestimate when launching in-store programs.
This guide helps professionals learn how to be a successful brand ambassador by improving in six key areas:
"The best brand ambassadors know how to turn everyday customer interactions into meaningful brand experiences."
Shoppers in a retail environment expect the brand ambassador in front of them to know more about the product than they do. When that expectation is met, purchase consideration rises. When it is not, shoppers return to the shelf or move on entirely. One of the fastest ways to lose customer trust is by being unable to respond to a simple question about your product.
Product mastery means more than reciting features. It means understanding how the product compares to competitors on the same shelf, knowing which concerns come up most often, and demonstrating with confidence. Hands-on product experience is the fastest path to that kind of authority. Representatives who have personally used or tested the product engage with a natural credibility that scripted knowledge rarely matches.
That knowledge is only useful if the ambassador is fully prepared to apply it. Successful retail brand ambassadors treat preparation as part of the job: reviewing retailer-specific guidelines ahead of time, confirming parking and check-in procedures, and verifying inventory and sampling supplies before the shift begins. Ambassadors who show up prepared spend their shift engaging shoppers instead of solving avoidable problems, like tracking down missing samples, figuring out store layout, or asking staff questions that should have been settled beforehand.
Research from Cornell University found that face-to-face requests are 34 times more persuasive than email-based communication.² That advantage holds only when the interaction feels genuine rather than rehearsed or forced.
Retail shoppers are sensitive to sales pressure. The most effective brand ambassadors often open with value: a product demonstration, a relevant question, or a comparison that helps the shopper decide. They read body language to assess when a shopper is open to dialogue and when a brief, non-intrusive introduction is more appropriate. The goal of the first exchange is to earn a few more seconds of attention, not to close the sale immediately.
Retailers grant floor access based on trust. A brand ambassador who arrives late, presents inconsistently, or behaves differently when management is absent reflects poorly on the brand that placed them there. Lost retail placements damage the brand's retailer relationship and limit future program opportunities.
Professionalism covers appearance, punctuality, communication with store management, and conduct throughout the shift, including how a representative handles slow traffic periods. High performers stay engaged during quiet stretches rather than visibly disengaging, and they treat the post as something to maintain, not a place to step away from. Leaving the post unattended and indulging in personal distractions are among the fastest ways to undo an otherwise strong shift. Keeping displays clean, restocking materials properly, and following store-specific protocols signals respect for the retailer's environment and strengthens the brand as a reliable long-term partner.
Store associates are not obstacles to work around. They are one of the most direct paths to higher foot traffic at a brand ambassador station. Associates who understand what is being demonstrated, and who have a positive impression of the representative, will direct relevant shoppers their way throughout the shift.
Successful retail brand ambassadors introduce themselves to department managers and floor staff at the start of every visit, explain what they are demonstrating, and position themselves as a resource rather than a distraction. For multi-visit programs, that investment compounds: managers who trust a representative advocate for better placement and support expanded access and future activations over time. That goodwill is what turns a single successful shift into a stronger, longer-running retailer relationship. For a closer look at how these relationships shape consumer behavior and long-term program performance, see The Impact of Brand Ambassadors on Consumer Behavior.
No two retail environments operate the same way. A big-box store has different traffic patterns and shopper expectations than a specialty retailer. A warehouse club operates differently than a pharmacy chain. Retail brand ambassadors who apply the same approach everywhere will underperform in most locations.
Key variables to assess at each location include shopper pace, average dwell time near the relevant category, and how competitive products are positioned nearby. Adaptability also applies within a single shift. Morning traffic, weekend patterns, and pre-holiday conditions all call for different energy levels and approaches.
Merchandising awareness is another factor worth watching: high performers observe shelf placement, competitor activity, pricing, displays, and out-of-stock situations, then report those insights back in the recap. This provides value that goes beyond the customer interaction itself. Brand ambassadors who read current conditions and adjust in real time consistently produce stronger results than those who hold to a fixed style throughout the day.
Retail brand ambassadors represent both the brand and the retailer at once, which means the rules of the space aren't optional. Following store-specific procedures, safety standards, and state or local regulations protects the retailer relationship and ensures every activation is executed with excellence and in full compliance with policy. This matters in every retail category, but it's especially critical in regulated categories like adult beverages, where compliance is one of the clearest signals of a well-executed and trustworthy program.
Field data is one of the most underutilized assets in retail brand ambassador programs. Tracking key metrics each shift gives program managers the intelligence needed to optimize placement, timing, and training. Numbers alone don't explain why a shift performed the way it did. Pairing them with the kind of on-the-ground observations covered earlier in this guide, like competitor activity or shopper hesitation, gives program managers the context to act on the data, not just see it.
Representatives who report structured observations become valuable beyond their direct sales contribution and strengthen the long-term program as a result. The second internal link on Cydcor's retail services shows how this kind of performance-based structure operates at scale.
Event brand ambassadors and retail brand ambassadors share surface-level similarities, but the operational realities are meaningfully different. Event staff typically work in controlled, brand-owned environments where the primary goal is awareness or lead capture during a fixed window of time.
Retail brand ambassadors work inside someone else's environment, under someone else's rules, alongside staff who have their own priorities and performance pressures. That additional layer of accountability changes the role fundamentally. Research confirms that 88% of global consumers trust recommendations from people they know more than any other advertising channel.³ Retail brand ambassadors who develop genuine rapport with regular shoppers and store staff over time become the local authority on their brand, a position that compounds in value across every subsequent visit, which is something a one-time event presence often cannot replicate.
Poor brand ambassadors lead to lost sales, damaged retailer relationships, reduced renewals, inconsistent brand representation. This hurts the store, the brand, and the individual ambassador. Great, high-effort brand ambassadors lead to higher conversions, better shopper experiences, retailer trust, and expanded retail programs that bring in more money for every party involved.
As a result, brand ambassador performance and effort is directly connected to measurable business outcomes.
Learning how to be a successful brand ambassador involves combining deep product knowledge, purposeful customer engagement, consistent professionalism, genuine store staff relationships, and environmental adaptability. These qualities are not a default outcome of enthusiasm or general sales experience. They are built through structured training and programs designed specifically around the demands of in-store brand representation.
Brands that invest in that foundation see the difference shift after shift. Whether you're launching a national big box roadshow, staffing retail demonstrations, or expanding into new retailers, experienced retail brand ambassadors can dramatically improve customer engagement and in-store sales.
Learn how Cydcor helps brands scale high-performing retail ambassador programs nationwide.
Sources
Team members at Cydcor have unique opportunities to gain meaningful business experience, grow through mentorship-driven development, explore non-linear career paths, and build rewarding careers.
But this environment is not for everyone. Understanding the benefits of working at Cydcor, and what we ask for in return, is the best starting point for any professional exploring it.
Cydcor's environment is built around collaboration, open communication, and a genuine investment in its people. With a close-knit team of nearly 175, the organization moves quickly without losing the cohesion that comes from a culture where a typical day is never typical. For professionals who want to grow fast and contribute meaningfully, that combination is hard to find.
Cydcor is a fast-paced, high-expectations business where curiosity and skill-building matter more than tenure. People earn opportunities based on what they learn and how they grow — not tenure. That same entrepreneurial spirit shows up in the work itself: Cydcor's team works alongside some of the biggest brands to create solutions and give people a rare mix of prestige and energy that's a big reason they love working here.
Growth at Cydcor isn't one-size-fits-all. Every person works from a development plan built around their individual goals, supported by training in areas like DiSC, Situational Leadership, time management, and AI skill-building, among many others. Leadership takes all forms here, from cross-departmental projects to involvement in cultural programs like philanthropy and special initiatives. Growth at Cydcor isn't linear, either; people can move across departments to match their skills and individual goals.
We call our people team members, not employees — a distinction that reflects how the business actually operates. Results come from people relying on each other, not working in isolation, and our culture is built around the idea that everyone is better together. It's collaboration over hierarchy: people are trusted to contribute ideas, take ownership of their work, and grow alongside the people around them.
Leadership at Cydcor is approachable, not distant. Team members across the company have direct access to leadership team members, and learning runs in both directions. Leaders invest as much in listening as they do in coaching; in fact, our open workspace lends itself to this kind of collaboration, making it easy for people to connect across teams and levels.

"If you want great results, you have to invest in the people around you," Quinn says. "It's about giving them the tools, the clarity, and the belief that they can achieve more than they thought possible."
Cydcor has earned 13 consecutive Best Place to Work in Los Angeles recognitions, a reflection of a culture where people across the company stay engaged and invested in each other's growth.
"Working at Cydcor provides opportunities to develop leadership skills, gain business experience, and accelerate professional growth through hands-on learning."
Is Cycdor a Fit for You?
Working at Cydcor means operating within an organization with more than 30 years of client relationships, industry credibility, and institutional knowledge behind it. For internal team members, that foundation translates into meaningful advantages that are difficult to replicate elsewhere.
Team members work alongside leaders with deep experience across sales, operations, client services, and organizational strategy. The collaborative structure means exposure to how a high-performing business functions across departments, not just within a single function. Cydcor's client relationships span telecom, energy, consumer services, consumer packaged goods, and business services, giving internal team members visibility into campaigns and partnerships with well-known brands at scale.
That combination of stability and performance has driven double-digit revenue growth for four consecutive years and earned Cydcor repeated recognition on the Inc. 5000 list of America's fastest-growing private companies, outcomes that reflect what happens when a strong leadership network and a high-performance culture operate together consistently.
What does the culture at Cydcor actually look like? Cydcor's culture is built around accountability, mentorship, and a genuine investment in the people who work there. High performance and strong team culture are treated as connected, not competing, which is reflected in the organization's sustained growth and repeated recognition as a top workplace.
What does career advancement look like internally? Advancement at Cydcor is merit-based and tied to demonstrated results rather than tenure. Team members who take ownership of their work, develop their skills, and invest in the people around them are consistently recognized and given greater responsibility over time.
What kinds of roles exist at Cydcor? Cydcor's internal team spans operations, campaign management, marketing, technology, and leadership functions. Team members deal closely with the network of independent sales companies Cydcor works with, giving them meaningful exposure to client relationships, sales strategy, and business operations across multiple industries.
What makes Cydcor different from other companies to work for? The combination of an entrepreneurial mindset and organizational stability is uncommon. Cydcor operates with the urgency and accountability of a performance-driven business while offering team members the resources, leadership access, and community of a company with more than three decades of proven success.
The benefits of working at Cydcor come down to this: it's a place that takes growth seriously, and it shows up in everything from how people are coached to how leadership stays accessible. Development here at Cydcor is personalized, leadership is within reach, and the people who thrive are the ones who stay curious and invest in each other.
If that sounds like the kind of environment you want to be part of, Cydcor offers real responsibility, direct access to experienced leaders, and a culture built on one simple belief: when people grow, the business grows with them.